
More freight needs to be transported as a result of booming economic activity. The quantity of commodities that are imported and exported through the transportation sector is referred to as the freight volume. The commercial vehicle (CV) market handles nearly all physical goods produced or traded in the US economy.
Why Is Freight Volume Important?
To respond effectively to opportunities and challenges, businesses must maintain a thorough understanding of market trends, regardless of the state of the economy.
The quantity of freight that moves between these parties will affect how they do business since shippers own or supply the items (freight) that carriers will convey, and brokers serve as middlemen between them. To effectively plan for the future, businesses gain from having precise freight volume information.
The idea of a pendulum is a useful tool for considering supply and demand in the truckload (TL) market. The pendulum swings to the fleets and freight rates increase when demand exceeds capacity and there is a shortage of drivers or tractors. The pendulum swings in favor of the shipper, and freight rates decrease when supply growth exceeds demand growth. It is cyclical to try to balance long-term companies with short-term variations in freight demand.
How Is Freight Volume Measured?
The extent of internal data can be restrictive for any business, and obtaining a more comprehensive market study can be too expensive. To address this, ACT Research collects data from a wide range of TL carriers in a confidential manner, with a focus on small and mid-size TL carriers that transport a significant amount of freight in the North American market. Among the components of information are:
- trends in business volume,
- trends in market prices, and
- expectations for the purchase and sale of automobiles.
To provide a thorough view of changes in the transportation and CV industries, the ACT For-Hire Trucking Index polls carriers.
To obtain information on current market trends and the condition of the shipping industry, ACT Research also collaborates with Cass Information Systems, Inc., the biggest freight billing processor in the country. ACT forecasts freight demand using the Truckload Linehaul Index®, a pricing indicator, and the Cass Freight Index®, which evaluates freight volumes and expenses.
What does ACT now say regarding the volume of freight?
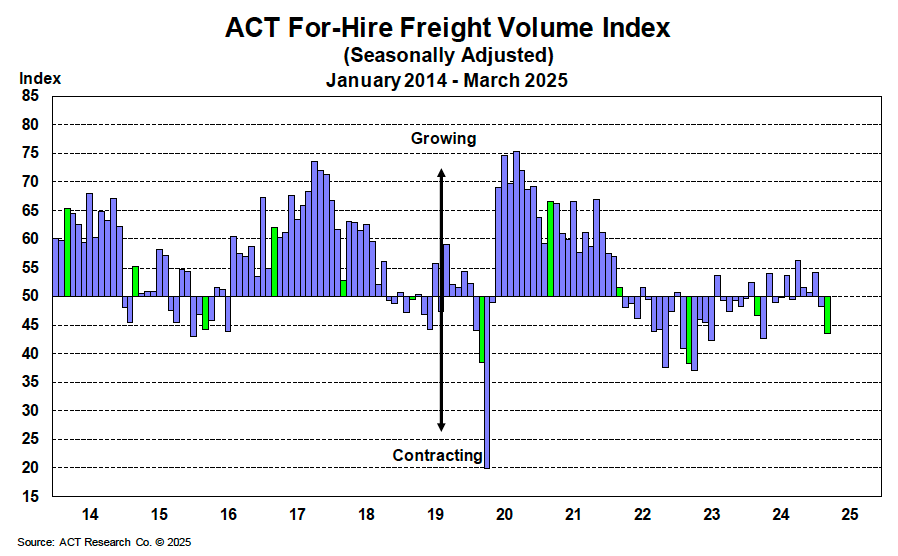
Updated Freight Volume Summary for May 2025
Although there is no discernible growth trend, freight levels are constant as of May 2025. The pre-tariff inventory activity bump has completely worn off, and although seasonal patterns are helping a little, overall growth has slowed. For the third straight month, the ACT For-Hire Trucking Volume Index stayed relatively steady in April, supporting the idea that the freight recovery is still erratic and brittle.
With the ongoing declines in the flow of discretionary products, retail freight has further deteriorated. Retailers are being forced to keep their inventory levels lower due to inflationary pressure, rising borrowing rates, and deteriorating customer mood. Core categories are the focus of restocking, and shippers are still hesitant to commit to forward inventory levels because of continuous cost volatility.
After being constant throughout the early spring, intermodal activity has begun to slow down. Shippers are adjusting to increased landing costs and shifting sourcing trends while port volumes have stabilized. Even though service reliability has increased, slower global demand and changes in trade policy, especially with China, are currently limiting volume growth.
Looking ahead, if industrial output and consumer expenditure continue to decline, freight volumes may experience fresh pressure in Q2. However, some volume stability is anticipated from key goods industries, including food and beverage, pharmaceuticals, and freight associated with infrastructure. Industry-wide freight planning is still cautious, with shippers and carriers prioritizing cost containment and flexibility above growth.
Forecasting Freight Volume
ACT Research measures industry volumes (demand) using two main metrics when predicting the truckload and less-than-truckload markets:
In summary, both gauge the level of customer demand that motivates a carrier to convey products. Stated differently, measurements of the amount of freight transported.
The quantity of freight shipments that Cass Information Systems transports within North America is measured by the Cass Freight Index®- Shipments. Cass is the best resource for determining shipper volumes, handling over $44 billion in freight transactions every year.
The estimated total freight transported by sector is measured by the ACT Freight Composite Index, which was created by ACT Research.
When combined with ACT’s capacity (supply) metrics, these two demand metrics offer a supply-demand balance by revealing the anticipated volumes of freight delivered over the next six to thirty-six months.